loquin
Well-Known Member
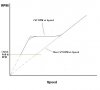
Exactly. The breakpoints on the chart are estimates of the points on a curve where the greatest rate of change is taking place. They are not exact. Near the breakpoints, the speed/RPM is changing smoothly - not with a discontinuity. Straight lines were used for convenience.
A more accurate chart of RPM versus Speed would look more like the sketch, below. The problem is that it's very difficult, if not impossible to actually KNOW when on the curve the actual Speed/RPM differs from the straight-line method, as it depends on the amount of throttle you're giving the engine, as well as the load on the output, plus probably several other variables :mad5:
A more accurate chart of RPM versus Speed would look more like the sketch, below. The problem is that it's very difficult, if not impossible to actually KNOW when on the curve the actual Speed/RPM differs from the straight-line method, as it depends on the amount of throttle you're giving the engine, as well as the load on the output, plus probably several other variables
:mad5: